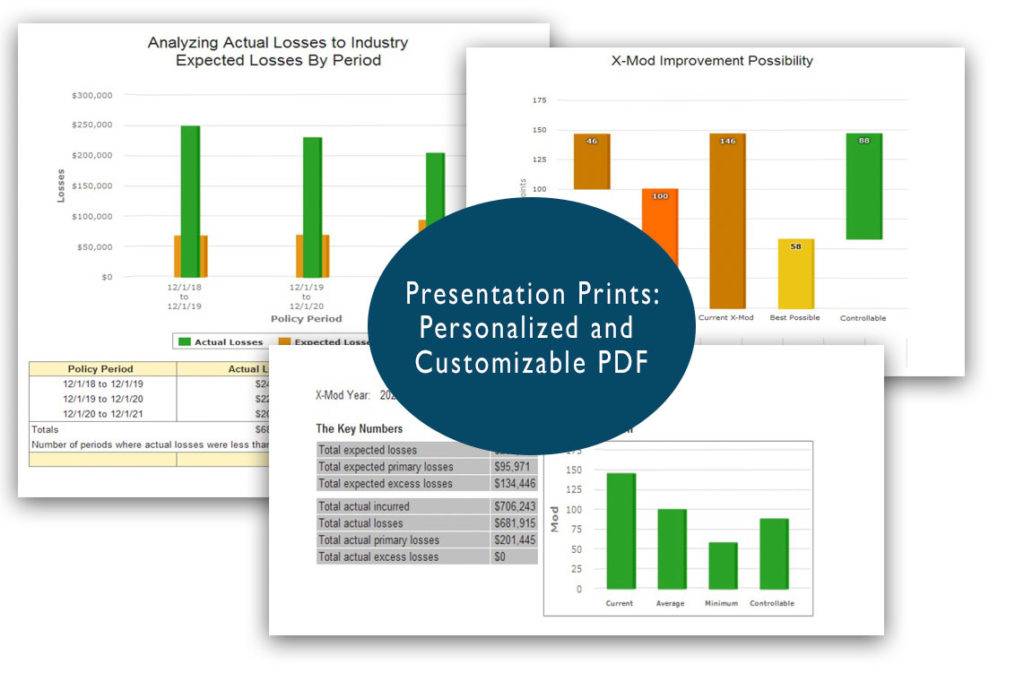
X-Mod Data Summary
This graphic details all X-Mod data. Displaying for the current year, it outlines the key numbers in factoring the X-Mod calculation, the impact of the losses and the actual vs. expected losses for the policy periods.
A Producers Handbook of Solutions In a ready-made Personalized and Customizable PDF
- Educate on the impact of claims to the X-Mod with detail and summary X-Mod Reports
- Conduct powerful full mod analyses by payroll, claim, type and compare to others in the industry
- Uncover hidden cost driver with Loss to Cost Relativity
- View Top losses by the cause of injury

Class Code Reports & X-Ref with Graphs
Compline provides a range of tools to help explain the system. A class code graph with rates back to 1986 as well as cross referencing the classes (insofar as possible) to SIC and NAICS codes, CSLB contractor classes, related classes and alternative descriptions.
If you are already a member, login here »
